August 2014

I have been under the impression that my fellow Americans are growing apart, ever widening the Ideologies Gap that further separates our communities – families, classmates, co-workers, neighbors and friends – just as the collective craving is growing for a greater “sense of community.” I have written about this several times, including my piece in the Christian Science Monitor a couple of years back.
However, a recent study was conducted by the Program for Public Consultation (PPC), a joint program of the Voice of the People, the Center on Policy Attitudes and the School of Public Policy at the University of Maryland, in red and blue states. The Study – titled “A Not So Divided America: Is the public as polarized as Congress or
are red and blue districts pretty much the same?” – found an “overwhelming convergence in attitudes, regardless of the makeup of the state or district where people live. People in red districts or states and those in blue districts or states truly disagreed with each other just 4 percent of the time,” according to the July 4th edition of the Washington Post.
While the U.S. Congress is conspicuously polarized along partisan lines it’s inaccurate to assume this translates to their constituents. Rather than a polarized population, members of Congress are responding to the power and money of special interests, and their own partisan agendas, according to the Post.
The PPC Study included 388 questions on a wide range of issues; it asked respondents to respond to a policy choice the government could make or had already made. Out of these 388 questions only 14 were deemed to be in conflict. According to the Voice of the People campaign:
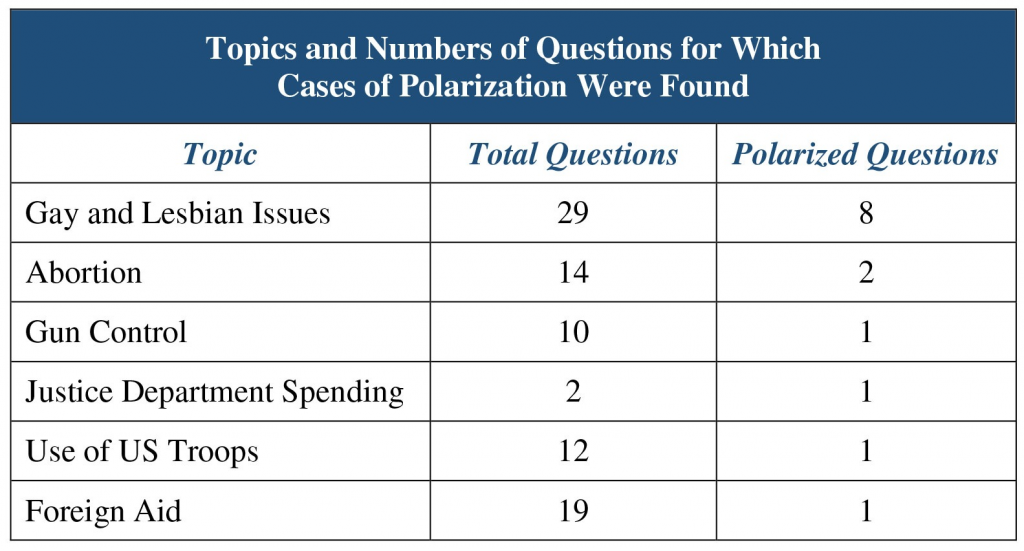
The questions for which there was any red-blue district or state polarization—i.e., for which majorities or pluralities took opposing positions in one or more questions—covered six topics in all. Three of these topics were “hot-button” topics that are famously controversial—gay and lesbian issues, abortion, and Second Amendment issues relating to gun ownership—and these accounted for 11 out of the 14 polarized questions. The other three topics were not “hot-button” topics and had a single polarized question each: Justice Department spending, the use of U.S. troops, and foreign aid.
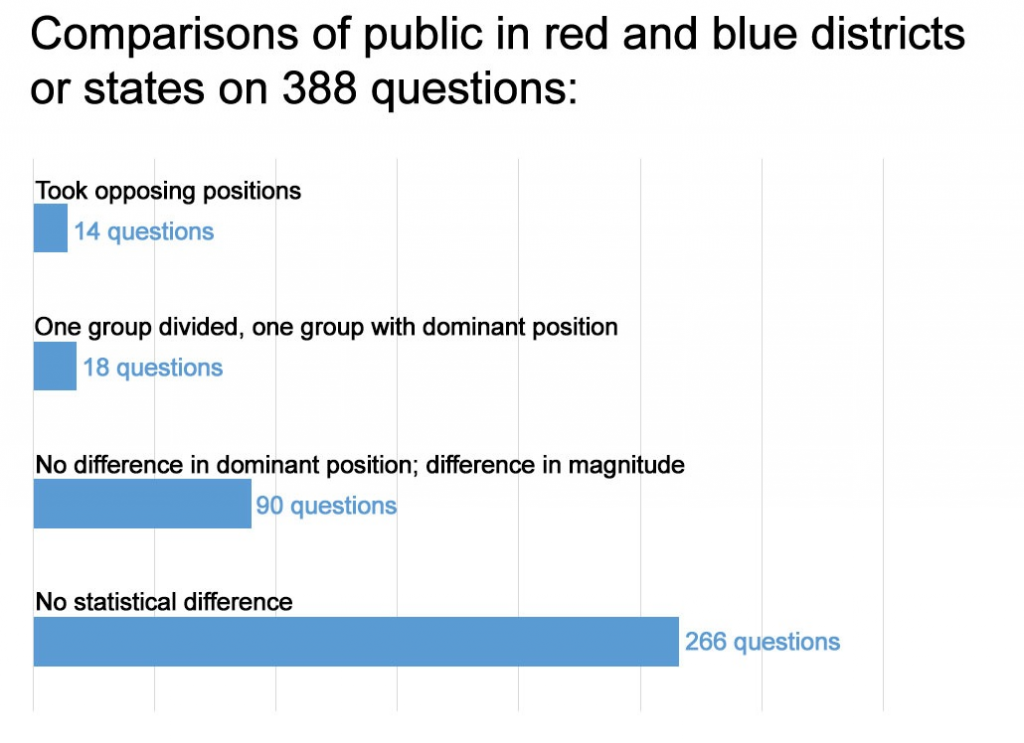
Below are two charts identifying those issues where polarization was found. The first includes topics. The second is a bar graph comparing the small portion of polarizing questions compared to the total questions posed:

All three graphs provided by the Program for Public Consultation (PPC)
As I was immersed in writing this article, I learned of another study by Pew Research that appeared to conclude different, even opposing findings. The lead sentence of the Pew study: “Republicans and Democrats are more divided along ideological lines – and partisan antipathy is deeper and more extensive – than at any point in the last two decades.”
Director Steven Kull who led the PPC Study explains that the PPC Study was focused on policies, asking what should government do or have done, rather than ideologies. He explained that the broader the brush of generalizations, the closer to ideology and slogans you get, the more polarized are the findings. As respondents focus more on specific actions and policies the more convergence occurs.
The key difference in the two studies is the focus on ideology (as with Pew) versus policy or right action by the government (as with the PPC Study). The media gave more attention to the increased polarization in ideologies rather than the convergence when it comes to policies or actions, explains Kull.
The chart below compares the views of people who live in red Congressional districts or states to those of people who live in blue districts or states. As the graph shows, only 3.6 percent of the questions — 14 out of 388 — did a majority take an opposing position.

For 4.6 percent of the questions – 18 out of 388 – there was a majority in one group of districts or states, but the other group was divided. For 23.2 percent – 90 out of 388 questions – there was significant differences in the size of the group taking the dominant position, but the dominant position was the same. For the remaining 68.6 percent – 266 out of 388 – there “were no statistical differences between the distribution of views in the red districts/states and the blue districts/states.”
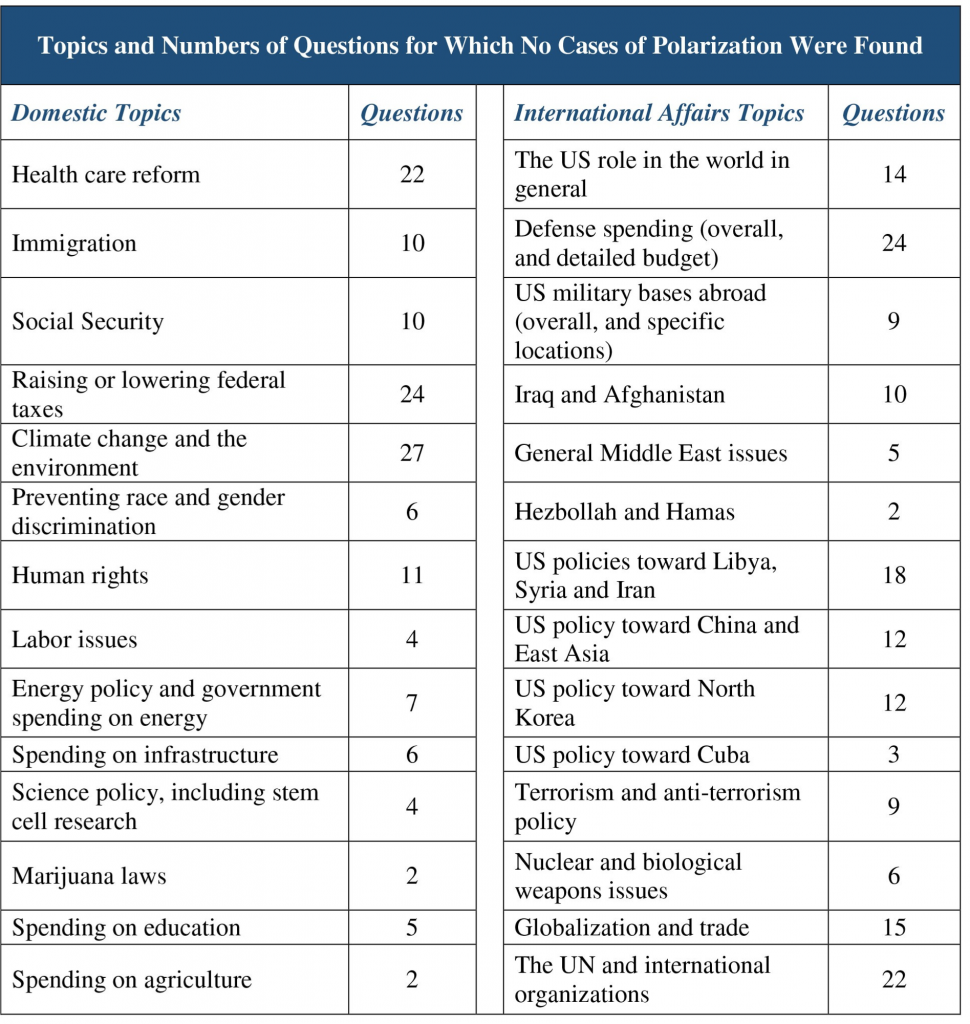
Below is another graph showing all the subjects where no polarization was found, where there was no significant differences between red and blue populations:

The PPC Study concluded by stating: “Based upon the data analyzed in this study, it is unlikely that polarization in the public is driving the polarization we see in Congress today. The striking similarity between red districts/states and blue districts/states on the vast majority of policy issues we reviewed suggests that red and blue districts are far more alike than different. On most issues, it appears America is not so divided after all.”
So what is going on here?
Are our Washington politicians so fixated on their ideologies and partisan positions that they are ignoring their constituents’ views and values? As I wrote in 2012, have they got their priorities upside down? Or, as the Washington Post opines, are our elected representatives simply responding to the power and money of special interests, and their own partisan agendas?
Regardless of the answer to these questions, there is a much more important question to be asking: why do we tolerate this behavior in people we hired to do one job but who insist on doing another? If we cannot ask ourselves this question and ponder our lack of willingness to say “I’m mad as hell and I won’t take this anymore!” then we do indeed have the governance that we deserve – dysfunctional, self-serving, incompetent, and corrupt.
Postscript: In case you need a reminder of the “Mad as Hell” scene from the classic 1976 movie “Network” click here to watch this six minute video excerpt.